Hamilton utility takes the wireless leap

By Toronto Star


NFPA 70b Training - Electrical Maintenance

Our customized live online or in‑person group training can be delivered to your staff at your location.

  • Live Online
  • 12 hours Instructor-led
  • Group Training Available
Regular Price:
$599
Coupon Price:
$499
Reserve Your Seat Today
Hamilton, the country's 10th largest city, could soon see its streets, neighbourhoods and parks transformed into a massive wireless hotspot, capable of offering cheap high-speed Internet access to all who pass through.

It's a vision that was outlined recently by Art Leitch, president and chief executive officer of Hamilton Utilities Corp., which is testing the use of Wi-Fi technology as a way of interacting with the tens of thousands of smart meters to be installed in homes and businesses over the coming 18 months.

"We know we need a telecommunications system to support smart metering," said Leitch. "The need to have telecommunications connected to every smart meter with every customer would lead us to having a Wi-Fi system that would make Hamilton a whole-city hotspot."

The creation of such a hotspot would put Hamilton in the same league as many U.S. cities, such as Philadelphia, which sees ubiquitous Wi-Fi coverage as a way of bridging a "broadband divide" often ignored by cable and local phone companies.

In the process, cities can attract tourists and business professionals, give their roving police better access to law enforcement databases, and allow for remote monitoring of parking meters and other automated services.

Last year, the City of Fredericton launched its downtown Fred eZone, permitting anyone with a Wi-Fi equipped laptop or hand-held computer to wirelessly access the Internet in public spaces, from park benches to outdoor patios.

In Hamilton, however, government policy is indirectly driving the move to Wi-Fi. The province has mandated that 800,000 smart meters be in place by the end of 2007. In reaching that goal, utilities need to figure out how to send and receive data from those meters for billing and load-management purposes.

Hydro One Inc., for example, announced this week that it will use a Rogers Wireless mobile network to communicate with 25,000 meters as part of a major pilot project.

"We're investigating a business application we have to deliver. The investments have to be made anyway," said Ian Collins, president of Fibrewired Network-Hamilton, an affiliate of Hamilton Utilities. "The question is, can we create other applications and uses from that investment?"

PUC Telecom Inc., the telecommunications subsidiary of Sault Ste. Marie-based utility PUC Inc., asked the same question last February when it began testing a new broadband data service that relies on Wi-Fi hotspots.

Martin Wyant, general manager of PUC Telecom, said utilities will have to at least consider this approach, and the associated new revenues streams, as the industry moves toward the concept of an intelligence grid that can monitor network loads and prevent the kind of situations that lead to massive blackouts.

In the case of Hamilton Utilities, the decision was an easy one. Its Fibrewired affiliate has a fibre-optic network that already stretches throughout the municipality. Collins said it's a relatively simple job of connecting the fibre-optic network to Wi-Fi stations that will ultimately communicate with the smart meters.

The six-month trial, likely to begin in two months, will involve 100 smart meters in downtown Hamilton and neighbouring Stoney Creek.

"If we make the decision to go ahead and build this thing completely out, those (Wi-Fi) services would pop out quite quickly after that," said Collins.

The broadband access will not be free, but it will be affordable, he said.

Related News

Planning for Toronto?s Growing Electricity Needs

Toronto Grid Upgrade expands electricity capacity and reliability with new substations, upgraded transmission lines, and integrated renewable energy, supporting EV growth, sustainability goals, and resilient power for Toronto's growing residential and commercial sectors.


Key Points

A joint plan to boost grid capacity, add renewables, and improve reliability for Toronto's rising power demand.

✅ New substations and upgraded transmission lines increase capacity

✅ Integrates solar, wind, and storage for cleaner, reliable power

✅ Supports EV adoption, reduces outages, and future-proofs the grid


As Toronto's population and economy continue to expand, the surge in electricity demand in the city is also increasing rapidly. In response, the Ontario government, in partnership with the City of Toronto and various stakeholders, has launched an initiative to enhance the electricity infrastructure to meet future needs.

The Ontario Ministry of Energy and the City of Toronto are focusing on a multi-faceted approach that includes upgrades to existing power systems and the integration of renewable energy sources, as well as updated IoT cybersecurity standards for sector devices. This initiative is critical as Toronto looks towards a sustainable future, with projections indicating significant growth in both residential and commercial sectors.

Energy Minister Todd Smith highlighted the urgency of this project, stating, “With Toronto's growing population and dynamic economy, the need for reliable electricity cannot be overstated. We are committed to ensuring that our power systems are not only capable of meeting today's demands but are also future-proofed against the needs of tomorrow.”

The plan involves substantial investments in grid infrastructure to increase capacity and improve reliability. This includes the construction of new substations and the enhancement of old ones, along with the upgrading of transmission lines and exploration of macrogrids to strengthen reliability. These improvements are designed to reduce the frequency and severity of power outages while accommodating new developments and technologies such as electric vehicles, which are expected to place additional demands on the system.

Additionally, the Ontario government is exploring the potential for renewable energy sources, such as rooftop solar grids and wind, to be integrated into the city’s power grid. This shift towards green energy is part of a broader effort to reduce carbon emissions and promote environmental sustainability.

Toronto Mayor John Tory emphasized the collaborative nature of this initiative, stating, “This is a prime example of how collaboration between different levels of government and the private sector can lead to innovative solutions that benefit everyone. By enhancing our electricity infrastructure, we are not only improving the quality of life for our residents but also supporting Toronto's competitive edge as a global city.”

The project also includes a public engagement component, where citizens are encouraged to provide input on the planning and implementation phases. This participatory approach ensures that the solutions developed are in alignment with the needs and expectations of Toronto's diverse communities.

Experts agree that the timing of these upgrades is critical. As urban populations grow, the strain on infrastructure, especially in a powerhouse like Toronto, can lead to significant challenges. Proactive measures, such as those being implemented by Ontario and Toronto, and mirrored by British Columbia's clean energy shift underway on the west coast, are essential in avoiding potential crises and ensuring economic stability.

The success of this initiative could serve as a model for other cities facing similar challenges, highlighting the importance of forward-thinking and cooperation in urban planning and energy management. As Toronto moves forward with these ambitious plans, the eyes of the world, particularly other urban centers, will be watching and learning how to similarly tackle the dual challenges of growth and sustainability, with recent examples like London's newest electricity tunnel demonstrating large-scale grid upgrades.

This strategic approach to managing Toronto's electricity needs reflects a comprehensive understanding of the complexities involved in urban energy systems and a commitment to ensuring a resilient and sustainable future that aligns with Canada's net-zero grid by 2050 goals at the national level for all residents.


Related News

View more

Why electric buses haven't taken over the world—yet

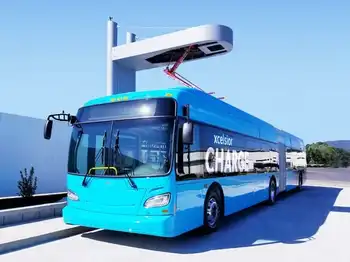
Electric Buses reduce urban emissions and noise, but require charging infrastructure, grid upgrades, and depot redesigns; they offer lower operating costs and simpler maintenance, with range limits influencing routes, schedules, and on-route fast charging.


Key Points

Battery-electric buses cut emissions and noise while lowering operating and maintenance costs for transit agencies.

✅ Lower emissions, noise; improved rider experience

✅ Requires charging, grid upgrades, depot redesigns

✅ Range limits affect routes; on-route fast charging helps


In lots of ways, the electric bus feels like a technology whose time has come. Transportation is responsible for about a quarter of global emissions, and those emissions are growing faster than in any other sector. While buses are just a small slice of the worldwide vehicle fleet, they have an outsize effect on the environment. That’s partly because they’re so dirty—one Bogotá bus fleet made up just 5 percent of the city’s total vehicles, but a quarter of its CO2, 40 percent of nitrogen oxide, and more than half of all its particulate matter vehicle emissions. And because buses operate exactly where the people are concentrated, we feel the effects that much more acutely.

Enter the electric bus. Depending on the “cleanliness” of the electric grid into which they’re plugged, e-buses are much better for the environment. They’re also just straight up nicer to be around: less vibration, less noise, zero exhaust. Plus, in the long term, e-buses have lower operating costs, and related efforts like US school bus electrification are gathering pace too.

So it makes sense that global e-bus sales increased by 32 percent last year, according to a report from Bloomberg New Energy Finance, as the age of electric cars accelerates across markets worldwide. “You look across the electrification of cars, trucks—it’s buses that are leading this revolution,” says David Warren, the director of sustainable transportation at bus manufacturer New Flyer.

Today, about 17 percent of the world’s buses are electric—425,000 in total. But 99 percent of them are in China, where a national mandate promotes all sorts of electric vehicles. In North America, a few cities have bought a few electric buses, or at least run limited pilots, to test the concept out, and early deployments like Edmonton's first e-bus offer useful lessons as systems ramp up. California has even mandated that by 2029 all buses purchased by its mass transit agencies be zero-emission.

But given all the benefits of e-buses, why aren’t there more? And why aren’t they everywhere?

“We want to be responsive, we want to be innovative, we want to pilot new technologies and we’re committed to doing so as an agency,” says Becky Collins, the manager of corporate initiative at the Southeastern Pennsylvania Transportation Authority, which is currently on its second e-bus pilot program. “But if the diesel bus was a first-generation car phone, we’re verging on smartphone territory right now. It’s not as simple as just flipping a switch.”

One reason is trepidation about the actual electric vehicle. Some of the major bus manufacturers are still getting over their skis, production-wise. During early tests in places like Belo Horizonte, Brazil, e-buses had trouble getting over steep hills with full passenger loads. Albuquerque, New Mexico, canceled a 15-bus deal with the Chinese manufacturer BYD after finding equipment problems during testing. (The city also sued). Today’s buses get around 225 miles per charge, depending on topography and weather conditions, which means they have to re-up about once a day on a shorter route in a dense city. That’s an issue in a lot of places.

If you want to buy an electric bus, you need to buy into an entire electric bus system. The vehicle is just the start.

The number one thing people seem to forget about electric buses is that they need to get charged, and emerging projects such as a bus depot charging hub illustrate how infrastructure can scale. “We talk to many different organizations that get so fixated on the vehicles,” says Camron Gorguinpour, the global senior manager for the electric vehicles at the World Resources Institute, a research organization, which last month released twin reports on electric bus adoption. “The actual charging stations get lost in the mix.”

But charging stations are expensive—about $50,000 for your standard depot-based one. On-route charging stations, an appealing option for longer bus routes, can be two or three times that. And that’s not even counting construction costs. Or the cost of new land: In densely packed urban centers, movements inside bus depots can be tightly orchestrated to accommodate parking and fueling. New electric bus infrastructure means rethinking limited space, and operators can look to Toronto's TTC e-bus fleet for practical lessons on depot design. And it’s a particular pain when agencies are transitioning between diesel and electric buses. “The big issue is just maintaining two sets of fueling infrastructure,” says Hanjiro Ambrose, a doctoral student at UC Davis who studies transportation technology and policy.

“We talk to many different organizations that get so fixated on the vehicles. The actual charging stations get lost in the mix as the American EV boom gathers pace across sectors.”

Then agencies also have to get the actual electricity to their charging stations. This involves lengthy conversations with utilities about grid upgrades, rethinking how systems are wired, occasionally building new substations, and, sometimes, cutting deals on electric output, since electric truck fleets will also strain power systems in parallel. Because an entirely electrified bus fleet? It’s a lot to charge. Warren, the New Flyer executive, estimates it could take 150 megawatt-hours of electricity to keep a 300-bus depot charged up throughout the day. Your typical American household, by contrast, consumes 7 percent of that—per year. “That’s a lot of work by the utility company,” says Warren.

For cities outside of China—many of them still testing out electric buses and figuring out how they fit into their larger fleets—learning about what it takes to run one is part of the process. This, of course, takes money. It also takes time. Optimists say e-buses are more of a question of when than if. Bloomberg New Energy Finance projects that just under 60 percent of all fleet buses will be electric by 2040, compared to under 40 percent of commercial vans and 30 percent of passenger vehicles.

Which means, of course, that the work has just started. “With new technology, it always feels great when it shows up,” says Ambrose. “You really hope that first mile is beautiful, because the shine will come off. That’s always true.”


Related News

View more

Purdue: As Ransomware Attacks Increase, New Algorithm May Help Prevent Power Blackouts

Infrastructure Security Algorithm prioritizes cyber defense for power grids and critical infrastructure, mitigating ransomware, blackout risks, and cascading failures by guiding utilities, regulators, and cyber insurers on optimal security investment allocation.


Key Points

An algorithm that optimizes security spending to cut ransomware and blackout risks across critical infrastructure.

✅ Guides utilities on optimal security allocation

✅ Uses incentives to correct human risk biases

✅ Prioritizes assets to prevent cascading outages


Millions of people could suddenly lose electricity if a ransomware attack just slightly tweaked energy flow onto the U.S. power grid, as past US utility intrusions have shown.

No single power utility company has enough resources to protect the entire grid, but maybe all 3,000 of the grid's utilities could fill in the most crucial security gaps if there were a map showing where to prioritize their security investments.

Purdue University researchers have developed an algorithm to create that map. Using this tool, regulatory authorities or cyber insurance companies could establish a framework for protecting the U.S. power grid that guides the security investments of power utility companies to parts of the grid at greatest risk of causing a blackout if hacked.

Power grids are a type of critical infrastructure, which is any network - whether physical like water systems or virtual like health care record keeping - considered essential to a country's function and safety. The biggest ransomware attacks in history have happened in the past year, affecting most sectors of critical infrastructure in the U.S. such as grain distribution systems in the food and agriculture sector and the Colonial Pipeline, which carries fuel throughout the East Coast, prompting increased military preparation for grid hacks in the U.S.

With this trend in mind, Purdue researchers evaluated the algorithm in the context of various types of critical infrastructure in addition to the power sector, including electricity-sector IoT devices that interface with grid operations. The goal is that the algorithm would help secure any large and complex infrastructure system against cyberattacks.

"Multiple companies own different parts of infrastructure. When ransomware hits, it affects lots of different pieces of technology owned by different providers, so that's what makes ransomware a problem at the state, national and even global level," said Saurabh Bagchi, a professor in the Elmore Family School of Electrical and Computer Engineering and Center for Education and Research in Information Assurance and Security at Purdue. "When you are investing security money on large-scale infrastructures, bad investment decisions can mean your power grid goes out, or your telecommunications network goes out for a few days."

Protecting infrastructure from hacks by improving security investment decisions

The researchers tested the algorithm in simulations of previously reported hacks to four infrastructure systems: a smart grid, industrial control system, e-commerce platform and web-based telecommunications network. They found that use of this algorithm results in the most optimal allocation of security investments for reducing the impact of a cyberattack.

The team's findings appear in a paper presented at this year's IEEE Symposium on Security and Privacy, the premier conference in the area of computer security. The team comprises Purdue professors Shreyas Sundaram and Timothy Cason and former PhD students Mustafa Abdallah and Daniel Woods.

"No one has an infinite security budget. You must decide how much to invest in each of your assets so that you gain a bump in the security of the overall system," Bagchi said.

The power grid, for example, is so interconnected that the security decisions of one power utility company can greatly impact the operations of other electrical plants. If the computers controlling one area's generators don't have adequate security protection, as seen when Russian hackers accessed control rooms at U.S. utilities, then a hack to those computers would disrupt energy flow to another area's generators, forcing them to shut down.

Since not all of the grid's utilities have the same security budget, it can be hard to ensure that critical points of entry to the grid's controls get the most investment in security protection.

The algorithm that Purdue researchers developed would incentivize each security decision maker to allocate security investments in a way that limits the cumulative damage a ransomware attack could cause. An attack on a single generator, for instance, would have less impact than an attack on the controls for a network of generators, which sophisticated grid-disruption malware can target at scale, rather than for the protection of a single generator.

Building an algorithm that considers the effects of human behavior

Bagchi's research shows how to increase cybersecurity in ways that address the interconnected nature of critical infrastructure but don't require an overhaul of the entire infrastructure system to be implemented.

As director of Purdue's Center for Resilient Infrastructures, Systems, and Processes, Bagchi has worked with the U.S. Department of Defense, Northrop Grumman Corp., Intel Corp., Adobe Inc., Google LLC and IBM Corp. on adopting solutions from his research. Bagchi's work has revealed the advantages of establishing an automatic response to attacks, and analyses like Symantec's Dragonfly report highlight energy-sector risks, leading to key innovations against ransomware threats, such as more effective ways to make decisions about backing up data.

There's a compelling reason why incentivizing good security decisions would work, Bagchi said. He and his team designed the algorithm based on findings from the field of behavioral economics, which studies how people make decisions with money.

"Before our work, not much computer security research had been done on how behaviors and biases affect the best defense mechanisms in a system. That's partly because humans are terrible at evaluating risk and an algorithm doesn't have any human biases," Bagchi said. "But for any system of reasonable complexity, decisions about security investments are almost always made with humans in the loop. For our algorithm, we explicitly consider the fact that different participants in an infrastructure system have different biases."

To develop the algorithm, Bagchi's team started by playing a game. They ran a series of experiments analyzing how groups of students chose to protect fake assets with fake investments. As in past studies in behavioral economics, they found that most study participants guessed poorly which assets were the most valuable and should be protected from security attacks. Most study participants also tended to spread out their investments instead of allocating them to one asset even when they were told which asset is the most vulnerable to an attack.

Using these findings, the researchers designed an algorithm that could work two ways: Either security decision makers pay a tax or fine when they make decisions that are less than optimal for the overall security of the system, or security decision makers receive a payment for investing in the most optimal manner.

"Right now, fines are levied as a reactive measure if there is a security incident. Fines or taxes don't have any relationship to the security investments or data of the different operators in critical infrastructure," Bagchi said.

In the researchers' simulations of real-world infrastructure systems, the algorithm successfully minimized the likelihood of losing assets to an attack that would decrease the overall security of the infrastructure system.

Bagchi's research group is working to make the algorithm more scalable and able to adapt to an attacker who may make multiple attempts to hack into a system. The researchers' work on the algorithm is funded by the National Science Foundation, the Wabash Heartland Innovation Network and the Army Research Lab.

Cybersecurity is an area of focus through Purdue's Next Moves, a set of initiatives that works to address some of the greatest technology challenges facing the U.S. Purdue's cybersecurity experts offer insights and assistance to improve the protection of power plants, electrical grids and other critical infrastructure.


Related News

View more

Which of the cleaner states imports dirty electricity?

Hourly Electricity Emissions Tracking maps grid balancing areas, embodied emissions, and imports/exports, revealing carbon intensity shifts across PJM, ERCOT, and California ISO, and clarifying renewable energy versus coal impacts on health and climate.


Key Points

An hourly method tracing generation, flows, and embodied emissions to quantify carbon intensity across US balancing areas.

✅ Hourly traces of imports/exports and generation mix

✅ Consumption-based carbon intensity by balancing area

✅ Policy insights for renewables, coal, health costs


In the United States, electricity generation accounts for nearly 30% of our carbon emissions. Some states have responded to that by setting aggressive renewable energy standards; others are hoping to see coal propped up even as its economics get worse. Complicating matters further is the fact that many regional grids are integrated, and as America goes electric the stakes grow, meaning power generated in one location may be exported and used in a different state entirely.

Tracking these electricity exports is critical for understanding how to lower our national carbon emissions. In addition, power from a dirty source like coal has health and environment impacts where it's produced, and the costs of these aren't always paid by the parties using the electricity. Unfortunately, getting reliable figures on how electricity is produced and where it's used is challenging, even for consumers trying to find where their electricity comes from in the first place, leaving some of the best estimates with a time resolution of only a month.

Now, three Stanford researchers—Jacques A. de Chalendar, John Taggart, and Sally M. Benson—have greatly improved on that standard, and they have managed to track power generation and use on an hourly basis. The researchers found that, of the 66 grid balancing areas within the United States, only three have carbon emissions equivalent to our national average, and they have found that imports and exports of electricity have both seasonal and daily changes. de Chalendar et al. discovered that the net results can be substantial, with imported electricity increasing California's emissions/power by 20%.

Hour by hour
To figure out the US energy trading landscape, the researchers obtained 2016 data for grid features called balancing areas. The continental US has 66 of these, providing much better spatial resolution on the data than the larger grid subdivisions. This doesn't cover everything—several balancing areas in Canada and Mexico are tied in to the US grid—and some of these balancing areas are much larger than others. The PJM grid, serving Pennsylvania, New Jersey, and Maryland, for example, is more than twice as large as Texas' ERCOT, in a state that produces and consumes the most electricity in the US.

Despite these limitations, it's possible to get hourly figures on how much electricity was generated, what was used to produce it, and whether it was used locally or exported to another balancing area. Information on the generating sources allowed the researchers to attach an emissions figure to each unit of electricity produced. Coal, for example, produces double the emissions of natural gas, which in turn produces more than an order of magnitude more carbon dioxide than the manufacturing of solar, wind, or hydro facilities. These figures were turned into what the authors call "embodied emissions" that can be traced to where they're eventually used.

Similar figures were also generated for sulfur dioxide and nitrogen oxides. Released by the burning of fossil fuels, these can both influence the global climate and produce local health problems.

Huge variation
The results were striking. "The consumption-based carbon intensity of electricity varies by almost an order of magnitude across the different regions in the US electricity system," the authors conclude. The low is the Bonneville Power grid region, which is largely supplied by hydropower; it has typical emissions below 100kg of carbon dioxide per megawatt-hour. The highest emissions come in the Ohio Valley Electric region, where emissions clear 900kg/MW-hr. Only three regional grids match the overall grid emissions intensity, although that includes the very large PJM (where capacity auction payouts recently fell), ERCOT, and Southern Co balancing areas.

Most of the low-emissions power that's exported comes from the Pacific Northwest's abundant hydropower, while the Rocky Mountains area exports electricity with the highest associated emissions. That leads to some striking asymmetries. Local generation in the hydro-rich Idaho Power Company has embodied emissions of only 71kg/MW-hr, while its imports, coming primarily from Rocky Mountain states, have a carbon content of 625kg/MW-hr.

The reliance on hydropower also makes the asymmetry seasonal. Local generation is highest in the spring as snow melts, but imports become a larger source outside this time of year. As solar and wind can also have pronounced seasonal shifts, similar changes will likely be seen as these become larger contributors to many of these regional grids. Similar things occur daily, as both demand and solar production (and, to a lesser extent, wind) have distinct daily profiles.

The Golden State
California's CISO provides another instructive case. Imports represent less than 30% of its total electric use in 2016, yet California electricity imports provided 40% of its embodied emissions. Some of these, however, come internally from California, provided by the Los Angeles Department of Water and Power. The state itself, however, has only had limited tracking of imported emissions, lumping many of its sources as "other," and has been exporting its energy policies to Western states in ways that shape regional markets.

Overall, the 2016 inventory provides a narrow picture of the US grid, as plenty of trends are rapidly changing our country's emissions profile, including the rise of renewables and the widespread adoption of efficiency measures and other utility trends in 2017 that continue to evolve. The method developed here can, however, allow for annual updates, providing us with a much better picture of trends. That could be quite valuable to track things like how the rapid rise in solar power is altering the daily production of clean power.

More significantly, it provides a basis for more informed policymaking. States that wish to promote low-emissions power can use the information here to either alter the source of their imports or to encourage the sites where they're produced to adopt more renewable power. And those states that are exporting electricity produced primarily through fossil fuels could ensure that the locations where the power is used pay a price that includes the health costs of its production.


Related News

View more

Minnesota bill mandating 100% carbon-free electricity by 2040

Minnesota 100% Carbon-Free Electricity advances renewable energy: wind, solar, hydropower, hydrogen, biogas from landfill gas and anaerobic digestion; excludes incineration in environmental justice areas; uses renewable energy credits and streamlined permitting.


Key Points

Minnesota's mandate requires utilities to deliver 100% carbon-free power by 2040 with targets and EJ safeguards.

✅ Utilities must hit 90% carbon-free by 2035; 100% by 2040.

✅ Incineration in EJ areas excluded; biogas, wind, solar allowed.

✅ Compliance via renewable credits; streamlined permitting.


Minnesota Gov. Tim Walz, D, is expected to soon sign a bill establishing a clean electricity standard requiring utilities in the state to provide electricity from 100% carbon-free sources by 2040. The bill also calls for utilities to generate at least 55% of their electricity from renewable energy sources by 2035, a trajectory similar to New Mexico's clean electricity push underway this decade.

Electricity generated from landfill gas and anaerobic digestion are named as approved renewable energy technologies, but electricity generated from incinerators operating in “environmental justice areas”, reflecting concerns about renewable facilities violating pollution rules in some states, will not be counted toward the goal. Wind, solar, and certain hydropower and hydrogen energy sources are also considered renewable in the bill. 

The bill defines EJ areas as places where at least 40% of residents are not white, 35% of households have an income that’s below 200% of the federal poverty line, and 40% or more of residents over age 5 have “limited” English proficiency. Areas the U.S. state defines as “Indian country” are also considered EJ areas.

Some of the state’s largest electric utilities, like Xcel Energy and Minnesota Power, have already pledged to move to carbon-free energy, and utilities such as Alliant Energy have outlined carbon-neutral plans in the region, but this bill speeds up that goal by 10 years, Minnesota Public Radio reported. The bill calls for public utilities operating in the state to be 80% carbon-free and other electric utilities to be 60% carbon-free by 2030. All utilities must be 90% carbon-free by 2035 before ultimately hitting the 100% mark in 2040, according to the bill.  

The bill gives utilities some leniency if they demonstrate to state regulators that they can’t offer affordable power while working toward the benchmarks, acknowledging reliability challenges seen in places like California's grid during the clean energy transition. It also allows utilities to buy renewable energy credits to meet the standard instead of generating the energy themselves. 

Patrick Serfass, executive director of the American Biogas Council, said the bill will incentivize more biogas-related electricity projects, “which means the recycling of more organic material and more renewable electricity in the state. Those are all good things,” he said. ABC sees significant potential for biogas production in Minnesota, though the federal climate law has delivered mixed results for accelerating clean power deployment.

The bill also aims to streamline the permitting process for new energy projects in the state, even as some states consider limits on clean energy that would constrain utility use, and calls for higher minimum wage requirements for workers.


Related News

View more

In a record year for clean energy purchases, Southeast cities stand out

Municipal Renewable Energy Procurement surged as cities contracted 3.7 GW of solar and wind, leveraging green tariffs, community solar, and utility partnerships across the Southeast, led by Houston, RMI, and WRI data.


Key Points

The process by which cities contract solar and wind via utilities or green tariffs to meet climate goals.

✅ 3.7 GW procured in 2020, nearly 25% year-over-year growth

✅ Houston runs city ops on 500 MW solar, a record purchase

✅ Southeast cities use green tariffs and community solar


Cities around the country bought more renewable energy last year than ever before, reflecting how renewables may soon provide one-fourth of U.S. electricity across the grid, with some of the most remarkable projects in the Southeast, according to new data unveiled Thursday.

Even amid the pandemic, about eight dozen municipalities contracted to buy nearly 3.7 gigawatts of mostly solar and wind energy — enough to power more than 800,000 homes. The figure is almost a quarter higher than the year before.

Half of the cites listed as “most noteworthy” in Thursday’s release —  from research groups Rocky Mountain Institute and World Resources Institute — are in the region that stretches from Texas to Washington, D.C. 

Houston stands out for the sheer enormity of its purchase: In July, it began powering city operations entirely from nearly 500 megawatts of solar power — the largest municipal purchase of renewable energy ever in the United States, as renewable electricity surpassed coal nationwide.

The groups also feature smaller deals in North Carolina and Tennessee, achieved through a utility partnership called a green tariff.

“We wanted to recognize that Nashville and Charlotte were really blazing a new trail,” said Stephen Abbott, principal at the Rocky Mountain Institute.

And the nation’s capital shows how renewable energy can be a source of revenue: It’s leasing out its public transit station rooftops for 10 megawatts of community solar.

All of these strategies will be necessary for scores of U.S. cities to meet their ambitious climate goals, researchers believe. An interactive clean energy targets tracker shows all 95 clean energy procurements from the year in detail.


Tracker 
Even before former President Donald Trump promised to remove the United States from the Paris Climate Accord, a lack of federal action on climate left a void that some cities and counties were beginning to fill, as renewables hit a record 28% in a recent month. In 2015, the first year tracked by researchers at the Rocky Mountain Institute and the World Resources Institute, municipalities contracted to buy more than 1 gigawatt of wind, solar and other forms of clean energy. 

But when Trump officially set in motion the withdrawal from the climate agreement, the ranks of municipalities dedicated to 100% clean energy multiplied. Today there are nearly 200 of them. The growth in activity last year reflects, in part, that surge of new pledges.

“It takes a while to get city staff up to speed and understand the options, and create the roadmap and then start executing,” Abbott said. “There is a bit of a lag, but we’re starting to see the impact.”

Even in Houston — one of the earliest to begin procuring renewable energy — there has been a steep learning curve as market forces change and prices drop, including cheaper solar batteries shaping procurement strategies, said Lara Cottingham, Houston’s chief of staff and chief sustainability officer.

No matter how well resourced and educated their staff, cities have to clear a thicket of structural, political and economic challenges to procure renewable energy. Most don’t own their own sources of power. Nearly all face budget constraints. Few have enough land or government rooftops to meet their goals within city limits.

“Cities face a situation where it’s a square peg in a round hole,” Cottingham said.

The hurdles are especially steep in much of the Southeast, where only publicly regulated utilities can sell electricity to retail customers, even large ones such as major cities. That’s where a green tariff regime comes in: Cities can purchase clean energy from a third party, such as a solar company, using the utility as a go-between.

Early last year, Charlotte became the largest city to use such a program, partnering with Duke Energy and two North Carolina solar developers to build a solar farm 50 miles north in Iredell County. At first, the city will pay a premium for the energy, but in the latter half of the 20-year contract, as gas prices rise, it will save money compared to business as usual.

“Over the course of 20 years, it’s projected we would save about $2 million,” Katie Riddle, sustainability analyst with Charlotte, told the Energy News Network last year.

The growing size of projects, innovative partnerships like green tariff programs, and the improving economics all give Abbott hope that renewable energy investments from cities will only grow — even with the Trump presidency over and the country back in the Paris agreement.

And when cities meet their goals for procuring renewable energy for their own operations, they must then turn to an even bigger task: reducing the carbon footprint of every person in their jurisdiction with broader decarbonization strategies and community engagement.

“The city needs to do its part for sure,” said Houston’s Cottingham. “Then we have this challenge of how do we get everyone else to.”


Related News

View more

Sign Up for Electricity Forum’s Newsletter

Stay informed with our FREE Newsletter — get the latest news, breakthrough technologies, and expert insights, delivered straight to your inbox.

Electricity Today T&D Magazine Subscribe for FREE

Stay informed with the latest T&D policies and technologies.
  • Timely insights from industry experts
  • Practical solutions T&D engineers
  • Free access to every issue

Live Online & In-person Group Training

Advantages To Instructor-Led Training – Instructor-Led Course, Customized Training, Multiple Locations, Economical, CEU Credits, Course Discounts.

Request For Quotation

Whether you would prefer Live Online or In-Person instruction, our electrical training courses can be tailored to meet your company's specific requirements and delivered to your employees in one location or at various locations.