
NFPA 70b Training - Electrical Maintenance
Our customized live online or in‑person group training can be delivered to your staff at your location.

- Live Online
- 12 hours Instructor-led
- Group Training Available
Regular Price:
$699
Coupon Price:
$599
WASHINGTON
—
Electric energy storage enables grid flexibility for renewables using utility-scale batteries and pumped-storage hydropower, delivering high round-trip efficiency, scalable capacity, and longer durations, according to EIA data as intermittent generation and demand variability increase.
A Closer Look
Electric energy storage saves power for later use using batteries and pumped storage to boost efficiency.
Batteries: ~82% round-trip efficiency in 2019 (EIA)
Pumped-storage: ~79% round-trip efficiency in 2019 (EIA)
Pumped-storage 21.9 GW; utility-scale batteries 1.4 GW (Nov 2020)
Electric energy storage is becoming more important to the energy industry as the share of intermittent generating technologies, such as wind and solar, in the electricity mix increases. Electric energy storage helps to meet fluctuating demand, as many utilities see benefits from deployment, which is why it is often paired with intermittent sources. Storage technologies include batteries and pumped-storage hydropower, which capture energy and store it for later use and increasingly support EV-related grid flexibility as mobile chargers bring new options. Storage metrics can help us understand the value of the technology. Round-trip efficiency is the percentage of electricity put into storage that is later retrieved. The higher the round-trip efficiency, the less energy is lost in the storage process. According to data from the U.S. Energy Information Administration (EIA), in 2019, the U.S. utility-scale battery fleet operated with an average monthly round-trip efficiency of 82%, and pumped-storage facilities operated with an average monthly round-trip efficiency of 79%.
EIA’s Power Plant Operations Report provides data on utility-scale energy storage, and initiatives to enable storage in Ontario illustrate system-level integration, including the monthly electricity consumption and gross electric generation of energy storage assets, which can be used to calculate round-trip efficiency. The metrics reviewed here use the finalized data from the Power Plant Operations Report for 2019—the most recent year for which a full set of storage data is available.
Pumped-storage facilities are the largest energy storage resource in the United States, and regions anticipating tight supply, such as Ontario supply crunch, are also evaluating expanded storage portfolios. The facilities collectively account for 21.9 gigawatts (GW) of capacity and for 92% of the country’s total energy storage capacity as of November 2020.
In recent years, utility-scale battery capacity has grown rapidly as battery costs have decreased, and New York BESS is cited as a needed clean energy solution, underscoring this trend. As batteries have been increasingly paired with renewables in markets worldwide, including Ontario to rely on battery storage to meet rising demand, they have become the second-largest source of electricity storage. As of November 20, 2020, utility-scale battery capacity had 1.4 GW of operational capacity. Another 4.0 GW of battery capacity is scheduled to come online in 2021, according to EIA’s Preliminary Electric Generator Inventory.
Although battery storage has slightly higher round-trip efficiency than pumped storage, pumped-storage facilities typically operate at utilization factors that are currently twice as high as batteries. Increasing durations among battery applications could shift battery operations toward services that reward longer output periods. For example, in 2015, the weighted average battery duration was a little more than 46 minutes, but by 2019, weighted average battery durations had doubled to 1.5 hours, and emerging long-duration projects are targeting 100-hour capabilities. The role of batteries and their capability to provide high levels of round-trip efficiency may become more important as batteries continue to be deployed and as the intermittent renewables share of the electricity mix grows.
Related News
Related News
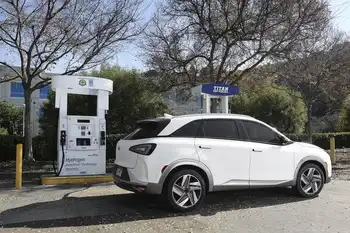
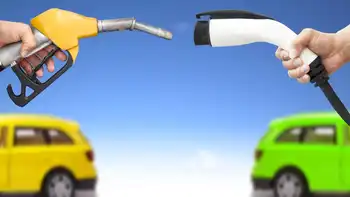
Electricity or hydrogen - What is the future of vehicles?
Hydrogen vs Battery-Electric Vehicles compare FCEV and BEV tech for range, charging and refueling, zero-emissions,…
View more
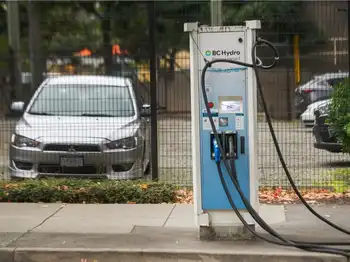
B.C. Hydro predicts 'bottleneck' as electric-vehicle demand ramps-up
B.C. EV Bottleneck signals a post-pandemic demand surge for electric vehicles amid semiconductor and lithium-ion…
View more

New investment opportunities open up as Lithuania seeks energy independence
Lithuania Wind Power Investment accelerates renewable energy expansion with utility-scale wind farms, solar power synergies,…
View more
Why Electric Vehicles Are "Greener" Than Ever In All 50 States
UCS EV emissions study shows electric vehicles produce lower life-cycle emissions than gasoline cars across…
View more
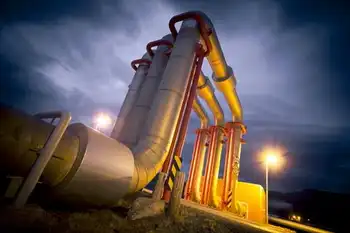
Aboitiz receives another award for financing for its Tiwi and Makban geothermal plant
AP Renewables Inc. Climate Bond Award recognizes Asia-Pacific project finance, with ADB and CNBC citing…
View more

Major investments by Canada and Quebec in electric vehicle battery assembly
Lion Electric Battery Plant Quebec secures near $100M public investment for an automated battery-pack assembly…
View more
Sign Up for Electricity Forum’s Newsletter
Stay informed with our FREE Newsletter — get the latest news, breakthrough technologies, and expert insights, delivered straight to your inbox.
Electricity Today T&D Magazine Subscribe for FREE

Stay informed with the latest T&D policies and technologies.
- Timely insights from industry experts
- Practical solutions T&D engineers
- Free access to every issue

