Board enacts controls on wind farms

By The Buffalo News


High Voltage Maintenance Training Online

Our customized live online or in‑person group training can be delivered to your staff at your location.

  • Live Online
  • 12 hours Instructor-led
  • Group Training Available
Regular Price:
$599
Coupon Price:
$499
Reserve Your Seat Today
The Town Board has unanimously embraced a zoning amendment setting standards for the development of wind farms.

Allegany is the second town in Cattaraugus County to open the door to wind-energy facilities. The Town Board approved the measure. The Town of Farmersville, which has no zoning, earlier this year adopted a law establishing a permitting process for wind farms. To date, the interested developer, Noble Environmental, has not submitted a permit application.

The Allegany amendment reserves the townÂ’s right to opt out of a 15-year property-tax exemption under state real property law, and also reserves a payment-in-lieu-of-taxes option, with funding distribution to be controlled by the town.

The Cattaraugus County Legislature, in anticipation of future development of wind-generated power plants, will vote in September on its own tax-revenue option to generate income from alternative energy facilities. If that law passes, the county will assess and tax wind-farm facilities as property.

“We’re a pro-business and pro-development type of board, but we’re not so gung-ho about giving out tax exemptions like they did in the ’90s,” said Allegany Supervisor Patrick H. Eaton. “We know how the system works. Property owners can pay their taxes, and the guy coming in off the street with a silk suit can pay their fair share of taxes, too.”

Allegany enacted a moratorium on wind-energy projects while the Planning Board drew up a proposed zoning amendment that would allow for special-use permit approval. Everpower Renewables, according to officials, is considering placing a wind farm in a sparsely populated area of the town known as Chipmonk, where a single property owner controls about 25,000 acres of timber.

On Wednesday, Eaton said he hopes property owners considering easements for wind-energy facilities will talk to several firms before signing contracts, adding that property owners should have the right to make some money on their land without excessive government controls.

The amendment generated both support and opposition from residents attending meetings and hearings on the issue over the past year.

Eaton said he had expected a packed house for the vote but was surprised at the low turnout and lack of emotion.

Absent from the meeting was Don Black, leader of the Allegany Wind Farm Committee, along with most of his 43-member group of property owners opposed to the project. Black said that most Allegany Wind Farm Committee members believed the zoning amendment would have passed even if 50 or 60 people turned out.

“We’re not opposed to windmills because I’m sure there’s a place for them, but we felt that Allegany isn’t the place for them. Some development may not be the best development,” he said.

The new zoning provisions require wind farm developers to present an engineering report that will determine adequacy of setbacks, risks of ice throw and tower collapse, and also call for a visual and noise analysis.

Related News

During this Pandemic, Save Money - How To Better Understand Your Electricity Bill

Commercial Electric Tariffs explain utility rate structures, peak demand charges, kWh vs kW pricing, time-of-use periods, voltage, delivery, capacity ratchets, and riders, guiding facility managers in tariff analysis for accurate energy savings.


Key Points

Commercial electric tariffs define utility pricing for energy, demand, delivery, time-of-use periods, riders, and ratchet charges.

✅ Separate kWh charges from kW peak demand fees.

✅ Verify time-of-use windows and demand interval length.

✅ Review riders, capacity ratchets, and minimum demand clauses.


Especially during these tough economic times, as major changes to electric bills are debated in some states, facility executives who don’t understand how their power is priced have been disappointed when their energy projects failed to produce expected dollar savings. Here’s how not to be one of them.

Your electric rate is spelled out in a document called a “tariff” that can be downloaded from your utility’s web page. A tariff should clearly spell out the costs for each component that is part of your rate, reflecting cost allocation practices in your region. Don’t be surprised to learn that it contains a bunch of them. Unlike residential electric rates, commercial electric bills are not based solely on the quantity of kilowatt-hours (kWh) consumed in a billing period (in the United States, that’s a month). Instead, different rates may apply to how your power is supplied, how it is delivered via electricity delivery charges, when it was consumed, its voltage, how fast it was used (in kW), and other factors.

If a tariff’s lingo and word structure are too opaque, spend some time with a utility account rep to translate it. Many state utility commissions also have customer advocates that may assist as they explore new utility rate designs that affect customers. Alternatively, for a fee, facility managers can privately chat with an energy consultant.

Common mistakes

Many facility managers try to estimate savings based on an averaged electric rate, i.e., annual electric spend divided by annual kWh. However, in markets where electricity demand is flat, such a number may obscure the fastest rising cost component: monthly peak demand charges, measured in dollars per kW (or kilo-volt-amperes, kVA).

This charge is like a monthly speeding ticket, based solely on the highest speed you drove during that time. In some areas, peak demand charges now account for 30 to 60 percent of a facility’s annual electric spend. When projecting energy cost savings, failing to separately account for kW peak demand and kWh consumption may result in erroneous results, and a lot of questions from the C-suite.

How peak demand charges are calculated varies among utilities. Some base it on the highest average speed of use across one hour in a month, while others may use the highest average speed during a 15- or 30-minute period. Others may average several of the highest speeds within a defined time period (for example, 8 a.m. to 6 p.m. on weekdays). It is whatever your tariff says it is.

Because some power-consuming (or producing) devices, including those tied to smart home electricity networks, vary in their operation or abilities, they may save money on a few — but not all — of those rate components. If an equipment vendor calculates savings from its product by using an average electric rate, take pause. Tell the vendor to return after the proposal has been redone using tariff-based numbers.

When a vendor is the only person calculating potential savings from using a product, there’s also a built-in conflict of interest: The person profiting from an equipment sale should not also be the one calculating its expected financial return. Before signing any energy project contracts, it’s essential that someone independent of the deal reviews projected savings. That person (typically an energy or engineering consultant) should be quite familiar with your facility’s electric tariff, including any special provisions, riders, discounts, etc., that may pertain. When this doesn’t happen, savings often don’t occur as planned. 

For example, some utilities add another form of demand charge, based on the highest kW in a year. It has various names: capacity, contract demand, or the generic term “ratchet charge.” Some utilities also have a minimum ratchet charge which may be based on a percent of a facility’s annual kW peak. It ensures collection of sufficient utility revenue to cover the cost of installed transmission and distribution even when a customer significantly cuts its peak demand.


Related News

View more

Cal ISO Warns Rolling Blackouts Possible, Calls For Conservation As Power Grid Strains

Cal ISO Flex Alert urges Southern California energy conservation as a Stage 2 emergency strains the power grid, with potential rolling blackouts during peak hours from 3 to 10 p.m., if demand exceeds supply.


Key Points

A statewide call to conserve power during high demand, issued by the grid operator to prevent rolling blackouts.

✅ Stage 2 emergency signals severe grid strain

✅ Peak Flex Alert hours: 3 to 10 p.m. statewide

✅ Set thermostats to 78 and avoid major appliances


Residents and businesses across Southern California were urged to conserve power Tuesday afternoon amid ongoing electricity inequities across the state as the manager of the state’s power grid warned rolling blackouts could be imminent for some power customers.

The California Independent System Operator (Cal ISO), which manages the state power grid, declared a Stage 2 emergency as of 2:30 p.m., indicating severe strain on the electrical system, similar to a recent grid alert in Alberta that relied on reserves.

ADVERTISING

Rolling blackouts for some customers could occur in a Stage 3 emergency, distinct from the intentional shut-offs some utilities use to reduce wildfire risk.

Cal ISO issued a statewide Flex Alert in effect from 3 to 10 p.m. Tuesday and Wednesday, with conservation considered especially critical during those hours, a concern heightened by pandemic-era grid operations this year.

Officials told reporters rolling blackouts might be avoided Tuesday evening if residents repeat the level of conservation seen Monday.
“If we can get the same sort of response we got yesterday, we can minimize this, or perhaps avoid it altogether,” Cal-ISO President/CEO Steve Berberich said, noting that some operators have even planned staff lockdowns during COVID-19 to maintain reliability.

Cal-ISO controls roughly 80% of the state’s power grid through Southern California Edison, Pacific Gas and Electric Co., with the utility recently restoring power after shut-offs in affected communities, and San Diego Gas & Electric.

Residents are urged to set thermostats at 78 in the afternoon and evening hours and avoiding the use of air conditioning and major appliances during the Flex Alert hours, as utilities like PG&E prepare for winter storms to improve resilience.


Related News

View more

South Australia rides renewables boom to become electricity exporter

Australia electricity grid transition is accelerating as renewables, wind, solar, and storage drive decentralised generation, emissions cuts, and NEM trade shifts, with South Australia becoming a net exporter post-Hazelwood closure and rooftop solar surging.


Key Points

Australia electricity shift to renewables, distributed generation and storage, cutting emissions, reshaping NEM flows.

✅ South Australia now exports power post-Hazelwood closure

✅ Rooftop solar is the fastest-growing NEM generation source

✅ Gas peaking and storage investments balance variable renewables


The politics may not change much, but Australia’s electricity grid is changing before our very eyes – slowly and inevitably becoming more renewable, more decentralised, and in step with Australia's energy transition that is challenging the pre-conceptions of many in the industry.

The latest national emissions audit from The Australia Institute, which includes an update on key electricity trends in the national electricity market, notes some interesting developments over the last three months.

The most surprising of those developments may be the South Australia achievement, which shows that since the closure of the Hazelwood brown coal generator in Victoria in March 2017, and as renewables outpacing brown coal in other markets, South Australia has become a net exporter of electricity, in net annualised terms.

Hugh Saddler, lead author of the study, notes that this is a big change for South Australia, which in 1999 and 2000, when it had only gas and local coal, used to import 30% of its electricity demand.

#google#

The fact that wholesale prices in South Australia were higher in other states – then, as they are now – has nothing to with wind and solar, but the fact that it has no low-cost conventional source and a peaky demand profile (then and now).

“The difference today is that the state is now taking advantage of its abundant resources of wind and solar radiation, and the new technologies which have made them the lowest cost sources of new generation, to supply much of its electricity requirements,” Saddler writes.

Other things to note about the flows between states is that Victoria was about equal on imports and exports with its three neighbouring states, despite the closure of Hazelwood. NSW continues to import around 10% of its needs from cheaper providers in Queensland.

Gas-fired generation had increased in the last year or two in South Australia as a result of the Northern closure, but is still below the levels of a decade ago.

But because it is expensive, this is likely to spur more investment in storage.

As for rooftop solar, Saddler notes that the share of residential solar in the grid is still relatively small but, despite excess solar risks flagged by distributors, it is the most steadily growing generation source in the NEM.

That line is expected to grow steadily. By 2040, or perhaps 2050, the share of distributed generation, which includes rooftop solar, battery storage and demand management, is expected to reach nearly half of all Australia’s grid demand.

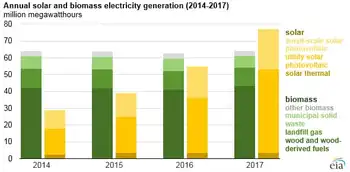
Saddler, says, however, that the increase in large-scale solar over the last few months is a significant milestone in Australia’s transition towards clean electricity generation, mirroring trends in India's on-grid solar development seen in recent years. (See very top graph).

“Firstly, they are a concrete demonstration that the construction cost advantage, which wind enjoyed over solar until a year or two ago, is gone.

“From now on we can expect new capacity to be a mix of both technologies. Indeed, the Clean Energy Regulator states that it expects solar to account for half of all (new renewable) capacity by 2020, and the US is moving toward 30% from wind and solar as well.”


Related News

View more

Clean-energy generation powers economy, environment

Atlin Hydro and Transmission Project delivers First Nation-led clean energy via hydropower to the Yukon grid, replacing diesel, cutting emissions, and creating jobs, with a 69-kV line from Atlin, B.C., supplying about 35 GWh annually.


Key Points

A First Nation-led 8.5 MW hydropower and 69-kV line supplying clean energy to the Yukon, reducing diesel use.

✅ 8.5 MW capacity; ~35 GWh annually to Yukon grid

✅ 69-kV, 92 km line links Atlin to Jakes Corner

✅ Creates 176 construction jobs; cuts diesel and emissions


A First Nation-led clean-power generation project for British Columbia’s Northwest will provide a significant economic boost and good jobs for people in the area, as well as ongoing revenue from clean energy sold to the Yukon.

“This clean-energy project has the potential to be a win-win: creating opportunities for people, revenue for the community and cleaner air for everyone across the Northwest,” said Premier John Horgan. “That’s why our government is proud to be working in partnership with the Taku River Tlingit First Nation and other levels of government to make this promising project a reality. Together, we can build a stronger, cleaner future by producing more clean hydropower to replace fossil fuels – just as they have done here in Atlin.”

The Province is contributing $20 million toward a hydroelectric generation and transmission project being developed by the Taku River Tlingit First Nation (TRTFN) to replace diesel electricity generation in the Yukon, which is also supported by the Government of Yukon and the Government of Canada, and comes as BC Hydro demand fell during COVID-19 across the province.

“Renewable-energy projects are helping remote communities reduce the use of diesel for electricity generation, which reduces air pollution, improves environmental outcomes and creates local jobs,” said Bruce Ralston, Minister of Energy, Mines and Low Carbon Innovation. “This project will advance reconciliation with TRTFN, foster economic development in Atlin and support intergovernmental efforts to reduce greenhouse gas emissions.”

TRTFN is based in Atlin with territory in B.C., the Yukon, and Alaska. TRTFN is an active participant in clean-energy development and, since 2009, has successfully replaced diesel-generated electricity in Atlin with a 2.1-megawatt (MW) hydro facility amid oversight issues such as BC Hydro misled regulator elsewhere in the province today.

TRTFN owns the Tlingit Homeland Energy Limited Partnership (THELP), which promotes economic development through clean energy. THELP plans to expand its hydro portfolio by constructing the Atlin Hydro and Transmission Project and selling electricity to the Yukon via a new transmission line, in a landscape shaped by T&D rates decisions in jurisdictions like Ontario for cost recovery.

The Government of Yukon is requiring its Yukon Energy Corporation (YEC) to generate 97% of its electricity from renewable resources by 2030. This project provides an opportunity for the Yukon government to reduce reliance on diesel generators and to meet future load growth, at a time when Manitoba Hydro's debt pressures highlight utility cost challenges.

The new transmission line between Atlin and the Yukon grid will include a fibre-optic data cable to support facility operations, with surplus capacity that can be used to bring high-speed internet connectivity to Atlin residents for the first time.

“Opportunities like this hydroelectricity project led by the Taku River Tlingit First Nation is a great example of identifying and then supporting First Nations-led clean-energy opportunities that will support resilient communities and provide clean economic opportunities in the region for years to come. We all have a responsibility to invest in projects that benefit our shared climate goals while advancing economic reconciliation.” said George Heyman, Minister of Environment and Climate Change Strategy.

“Thank you to the Government of British Columbia for investing in this important project, which will further strengthen the connection between the Yukon and Atlin. This ambitious initiative will expand renewable energy capacity in the North in partnership with the Taku River Tlingit First Nation while reducing the Yukon’s emissions and ensuring energy remains affordable for Yukoners.“ said Sandy Silver, Premier of Yukon.

“The Atlin Hydro Project represents an important step toward meeting the Yukon’s growing electricity needs and the renewable energy targets in the Our Clean Future strategy. Our government is proud to contribute to the development of this project and we thank the Government of British Columbia and all partners for their contributions and commitment to renewable energy initiatives. This project demonstrates what can be accomplished when communities, First Nations and federal, provincial and territorial governments come together to plan for a greener economy and future.” said John Streicker, Minister Responsible for the Yukon Development Corporation. 

“Atlin has enjoyed clean and renewable energy since 2009 because of our hydroelectric project. Over its lifespan, Atlin’s hydro opportunity will prevent more than one million tonnes of greenhouse gases from being created to power the southern Yukon. We are looking forward to the continuation of this project. Our collective dream is to meet our environmental and economic goals for the region and our local community within the next 10 years. We are so grateful to all our partners involved for their financial support, as we continue onward in creating an energy efficient and sustainable North.” said Charmaine Thom, Taku River Tlingit First Nation spokesperson.

Quick Facts:

  • The 8.5-MW project is expected to provide an average of 35 gigawatt hours of energy annually to the Yukon. To accomplish this, TRTFN plans to leverage the existing water storage capability of Surprise Lake, add new infrastructure, and send power 92 km north to Jakes Corner, Yukon, along a new 69-kilovolt transmission line.
  • The project is expected to cost $253 - 308.5 million, the higher number reflecting recently estimated impacts of inflation and supply chain cost escalation, alongside sector accounting concerns such as deferred BC Hydro costs noted in recent reports.
  • The project is expected to have a positive impact on local and provincial economic development in the form of, even as governance debates like Manitoba Hydro board changes draw attention elsewhere:
  • 176 full-time positions during construction;
  • six to eight full-time positions in operations and maintenance over 40 years; and
  • increased business for B.C. contractors.
  • Territorial and federal funders have committed $151.1 million to support the project, most recently the $32.2 million committed in the 2022 federal bdget.


Related News

View more

Wind Power Surges in U.S. Electricity Mix

U.S. Wind Power 2025 drives record capacity additions, with FERC data showing robust renewable energy growth, IRA incentives, onshore and offshore projects, utility-scale generation, grid integration, and manufacturing investment boosting clean electricity across key states.


Key Points

Overview of record wind additions, IRA incentives, and grid expansion defining the U.S. clean electricity mix in 2025.

✅ FERC: 30.1% of new U.S. capacity in Jan 2025 from wind

✅ Major projects: Cedar Springs IV, Boswell, Prosperity, Golden Hills

✅ IRA incentives drive onshore, offshore builds and manufacturing


In early 2025, wind power has significantly strengthened its position in the United States' electricity generation portfolio. According to data from the Federal Energy Regulatory Commission (FERC), wind energy accounted for 30.1% of the new electricity capacity added in January 2025, and as the most-used renewable source in the U.S., it also surpassed the previous record set in 2024. This growth is attributed to substantial projects such as the 390.4 MW Cedar Springs Wind IV and the 330.0 MW Boswell Wind Farm in Wyoming, along with the 300.0 MW Prosperity Wind Farm in Illinois and the 201.0 MW Golden Hills Wind Farm Expansion in Oregon. 

The expansion of wind energy capacity is part of a broader trend where solar and wind together accounted for over 98% of the new electricity generation capacity added in the U.S. in January 2025. This surge is further supported by the federal government's Inflation Reduction Act (IRA) and broader policy support for renewables, which has bolstered incentives for renewable energy projects, leading to increased investments and the establishment of new manufacturing facilities. 

By April 2025, clean electricity sources, including wind and solar, were projected to surpass 51% of total utility-scale electricity generation in the U.S., building on a 25.5% renewable share seen in recent data, marking a significant milestone in the nation's energy transition. This achievement is attributed to a combination of factors: a seasonal drop in electricity demand during the spring shoulder season, increased wind speeds in key areas like Texas, and higher solar production due to longer daylight hours and expanded capacity in states such as California, Arizona, and Nevada, supported by record installations across the solar and storage industry. 

Despite a 7% decline in wind power production in early April compared to the same period in 2024—primarily due to weaker wind speeds in regions like Texas—the overall contribution of wind energy remained robust, supported by an 82% clean-energy pipeline that includes wind, solar, and batteries. This resilience underscores the growing reliability of wind power as a cornerstone of the U.S. electricity mix. 

Looking ahead, the U.S. Department of Energy projects that wind energy capacity will continue to grow, with expectations of adding between 7.3 GW and 9.9 GW in 2024, and potentially increasing to 14.5 GW to 24.8 GW by 2028. This growth is anticipated to be driven by both onshore and offshore wind projects, with onshore wind representing the majority of new additions, continuing a trajectory since surpassing hydro capacity in 2016 in the U.S.

Early 2025 has witnessed a notable increase in wind power's share of the U.S. electricity generation mix. This trend reflects the nation's ongoing commitment to expanding renewable energy sources, especially after renewables surpassed coal in 2022, supported by favorable policies and technological advancements. As the U.S. continues to invest in and develop wind energy infrastructure, the role of wind power in achieving a cleaner and more sustainable energy future becomes increasingly pivotal.


Related News

View more

ACCIONA Energía Launches 280 MW Wind Farm in Alberta

Forty Mile Wind Farm delivers 280 MW of renewable wind power in Alberta, with 49 Nordex turbines by ACCIONA Energía, supplying clean electricity to the grid, lowering carbon emissions, and enabling future 120 MW expansion.


Key Points

A 280 MW ACCIONA Energía wind farm in Alberta with 49 Nordex turbines, delivering clean power and cutting carbon.

✅ 280 MW via 49 Nordex N155 turbines on 108 m towers

✅ Supplies clean power to 85,000+ homes, reducing emissions

✅ Phase II could add 120 MW, reaching 400 MW capacity


ACCIONA Energía, a global leader in renewable energy, has successfully launched its Forty Mile Wind Farm in southern Alberta, Canada, amid momentum from a new $200 million wind project announced elsewhere in the province. This 280-megawatt (MW) project, powered by 49 Nordex turbines, is now supplying clean electricity to the provincial grid and stands as one of Canada's ten largest wind farms. It also marks the company's largest wind installation in North America to date. 

Strategic Location and Technological Specifications

Situated approximately 50 kilometers southwest of Medicine Hat, the Forty Mile Wind Farm is strategically located in the County of Forty Mile No. 8. Each of the 49 Nordex N155 turbines boasts a 5.7 MW capacity and stands 108 meters tall. The project's design allows for future expansion, with a potential Phase II that could add an additional 120 MW, bringing the total capacity to 400 MW, a scale comparable to Enel's 450 MW U.S. wind farm now in operation. 

Economic and Community Impact

The Forty Mile Wind Farm has significantly contributed to the local economy. During its peak construction phase, the project created approximately 250 jobs, with 25 permanent positions anticipated upon full operation. These outcomes align with an Alberta renewable energy surge projected to power thousands of jobs across the province. Additionally, the project has injected new tax revenues into the local economy and provided direct financial support to local non-profit organizations, including the Forty Mile Family & Community Support Services, the Medicine Hat Women’s Shelter Society, and the Root Cellar Food & Wellness Hub. 

Environmental Benefits

Once fully operational, the Forty Mile Wind Farm is expected to generate enough clean energy to power more than 85,000 homes, supporting wind power's competitiveness in electricity markets today. This substantial contribution to Alberta's energy mix aligns with ACCIONA Energía's commitment to sustainability and its goal of reducing carbon emissions. The project is part of the company's broader strategy to expand its renewable energy footprint in North America and support the transition to a low-carbon economy. 

Future Prospects

Looking ahead, ACCIONA Energía plans to continue its expansion in the renewable energy sector, as peers like TransAlta add 119 MW in the U.S. to their portfolios. The success of the Forty Mile Wind Farm serves as a model for future projects and underscores the company's dedication to delivering sustainable energy solutions, even as Alberta's energy future presents periodic headwinds. With ongoing developments and a focus on innovation, ACCIONA Energía is poised to play a pivotal role in shaping the future of renewable energy in North America.

The Forty Mile Wind Farm exemplifies ACCIONA Energía's commitment to advancing renewable energy, supporting local communities, and contributing to environmental sustainability, and it benefits from evolving demand signals, including a federal green electricity contract initiative in Canada that encourages clean supply. As the project continues to operate and expand, it stands as a testament to the potential of wind energy in Canada's clean energy landscape.


Related News

View more

Sign Up for Electricity Forum’s Newsletter

Stay informed with our FREE Newsletter — get the latest news, breakthrough technologies, and expert insights, delivered straight to your inbox.

Electricity Today T&D Magazine Subscribe for FREE

Stay informed with the latest T&D policies and technologies.
  • Timely insights from industry experts
  • Practical solutions T&D engineers
  • Free access to every issue

Download the 2025 Electrical Training Catalog

Explore 50+ live, expert-led electrical training courses –

  • Interactive
  • Flexible
  • CEU-cerified