Electricity News in March 2017
Renewable Energy Study Released
Renewable Energy Subsidies drive market outcomes in a duopoly model, comparing mixed, output, and fixed…
View more
OPG Reports 2016 Financial Results
OPG 2016 Financial Results underscore Ontario Power Generation's net income growth, driven by nuclear fleet…
View more
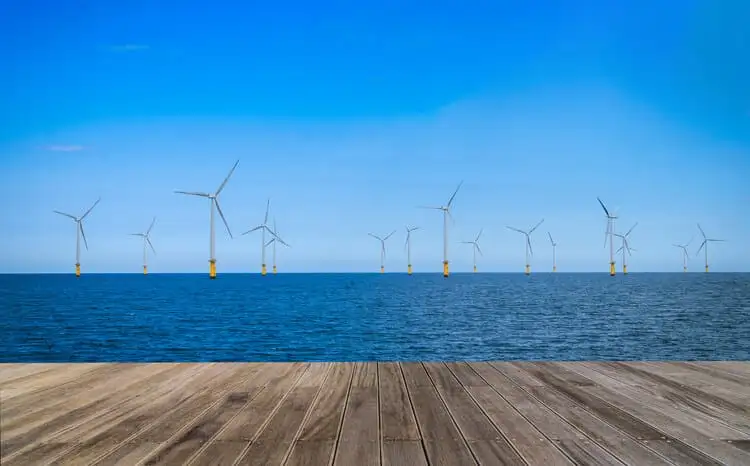
Comparative evaluation of different offshore wind turbine installation vessels for Korean west-south wind farm
Korean Offshore Wind Turbine Installation Vessels analyzed for WTIV, jack-up barge, and floating crane options,…
View more
India's on-grid solar power development. Historical transitions, present status and future driving forces
India On-Grid Solar Power is accelerating under supportive policies, ambitious targets, and grid integration efforts,…
View more
Digital Transformation of Commercial Buildings
Intelligent Buildings Trends 2017 spotlight IoT, analytics, energy management, and building automation, showing how data…
View more
Coal unit retirements addressed by Montana lawmakers
Colstrip plant closure legislation addresses coal power transitions at the 2,100 MW site, guiding decommissioning,…
View more
Projected electricity generation mix is sensitive to policies, natural gas prices
AEO2017 electricity fuel mix shows how natural gas prices, Clean Power Plan policy, and technology…
View more
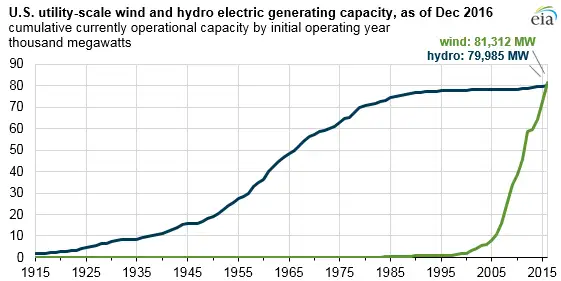
U.S. wind generating capacity surpasses hydro capacity at the end of 2016
US Wind and Hydropower Capacity surpassed milestones as wind overtook hydro in installed MW, yet…
View more
Warm weather leads to first recorded natural gas storage injection in February
First February Natural Gas Injection reflects warm weather, low heating degree days, EIA storage build…
View more
New White Paper from IEC assesses the worldwide need for Global Energy Interconnection
Global Energy Interconnection enables cross-border grids to share renewables, enhance reliability, and cut emissions through…
View more
Four-Year U.S. Wind Forecast Sees Quarter-Million Jobs
American Wind Power Expansion drives 248,000 jobs, $85B economic activity, 35 GW capacity growth, boosting…
View more
BOEM receives wind power lease requests
BOEM Offshore Wind Lease Requests advance offshore wind on the Outer Continental Shelf, with PNE…
View more
High electricity rates hurt Ontario factories, says industry group
Ontario Industrial Electricity Rates pressure manufacturers as hydro fees, global adjustment, and energy costs rise;…
View more

Massachusetts Issues Energy Storage Solicitation Offering $10M
Massachusetts Energy Storage Solicitation offers grants and matching funds via MassCEC and DOER for grid-connected,…
View more